Difference between revisions of "Finds tab"
(Merging several sections) |
(→Way to 81: Details) |
||
| Line 32: | Line 32: | ||
==Way to 81== | ==Way to 81== | ||
| − | + | ||
| + | A [[D/T grid]] showing all 81 combinations of Difficulty and Terrain ratings, with the number of caches found for each combination. By clicking on "Type: All" in the top right corner, the grid will cycle through various cache types (Traditional, Multi, Mystery, Letterbox, Earthcache, Virtual and back to All. | ||
| + | |||
| + | Below the grid is a summary of the number of the combinations, with a value and percentage of those with a difficulty or terrain rating of 3 or more. There is a link to the [[D/T Matrix Tool]] to help you find which caches you need to complete the next loop. | ||
| + | |||
| + | Filling in the grid increases your [[The Matrix Cacher|Matrix Cacher]] Badge. | ||
| + | |||
==Caches with most favorite points== | ==Caches with most favorite points== | ||
''Details to follow'' | ''Details to follow'' | ||
Revision as of 21:31, 4 March 2020
The Finds tab is the first tab displayed on a user's Profile stats page. Your own tab can be displayed on your geocaching profile using code generated by the Create dynamic image HTML code button. The page gives the number of caches that user has found, followed by information about the user's finds, as follows:
Contents
Cumulative finds by month
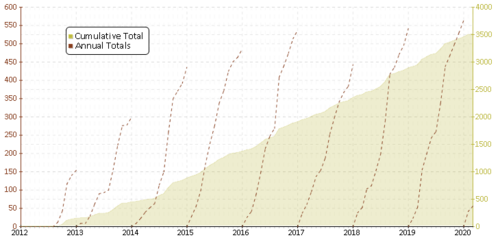
This is a chart of the number of caches found throughout the course of a year, shown as dashed lines for each year, which should be read against the left hand axis. The cumulative finds are shown in the darker shaded area of the graph, and should be read against the right hand axis.
Finds by month per year
Bar charts showing the number of finds each month in each year, with the number of days caching shown underneath. By default only the current and previous year are shown, but earlier years can be selected.
Some numbers
A list of miscellaneous statistics, generally self explanatory. The nearest and furthest caches, and the distance to the cache centroid, are only shown for your own statistics and hidden to other users for privacy reasons.
Log similarity is an indication of how much your logs differ - a high score means your logs have a lot of repeated content, a low score means they are more diverse.
Bar charts
Various self-explanatory bar charts showing values of the following:
- Finds by type
- Finds by size
- Finds by difficulty rating
- Finds by terrain rating
- Average difficulty per year
- Average terrain per year
- Finds by month
- Finds by weekday
- Finds by year cache placed
- Finds to current date for each year
Note that size, difficulty and terrain ratings are based on the current value of each cache, and may have changed from when you logged them. The maximum value of each is shown darker.
Way to 81
A D/T grid showing all 81 combinations of Difficulty and Terrain ratings, with the number of caches found for each combination. By clicking on "Type: All" in the top right corner, the grid will cycle through various cache types (Traditional, Multi, Mystery, Letterbox, Earthcache, Virtual and back to All.
Below the grid is a summary of the number of the combinations, with a value and percentage of those with a difficulty or terrain rating of 3 or more. There is a link to the D/T Matrix Tool to help you find which caches you need to complete the next loop.
Filling in the grid increases your Matrix Cacher Badge.
Caches with most favorite points
Details to follow
Oldest caches found
Details to follow
Highest and lowest elevations
Details to follow
Finds by found date
Details to follow
Details to follow
Finds by owner
Details to follow
Collected attributes
Details to follow
